Using the New Google Analytics API to Get Most Popular Pages
📣 Sponsor

It's often useful to get a list of the most popular pages on your website or app, either to feed into analytics, or to build UI elements which show users what your most popular content is. In times gone by, a hit counter might be used to track your most popular pages.
However, in the modern world, it's much easier to use the Google Analytics API. Since Google has recently updated Analytics to 'Google Analytics 4', and also changed the Javascript API, I thought I'd write a guide on how I've done this on Fjolt. For this tutorial I'll be using Node.JS.
Note: this will only work with the new Google Analytics 4, and will *NOT* work with previous versions of Google Analytics.
Google Analytics API
As mentioned, recently Google has upgraded us all to a new version of Google Analytics, simply known as 'Google Analytics 4'. The data model is completely different from older versions of Google Analytics, and Google has used this opportunity to standardise the API for it to align with what it uses for its other services.
This API is documented, but it is experimental, so it may change. However, I imagine the high level concepts used here will remain the same, and the data model for Google Analytics itself certainly will.
Step 1: Create a Google Service Account
A lot of programmers or developers from non traditional tech backgrounds often shirk in fear at the thought of a 'service account', but it is essentially an account that can login to a service to do an action for you, without requiring a human. To make one:
Go to the Google Developer Console and Create a New Project if you haven't already.
On the left side, click on "Credentials" and then Create Credentials. Select 'Service Account' as the type of credential. Fill in the details and click Done.
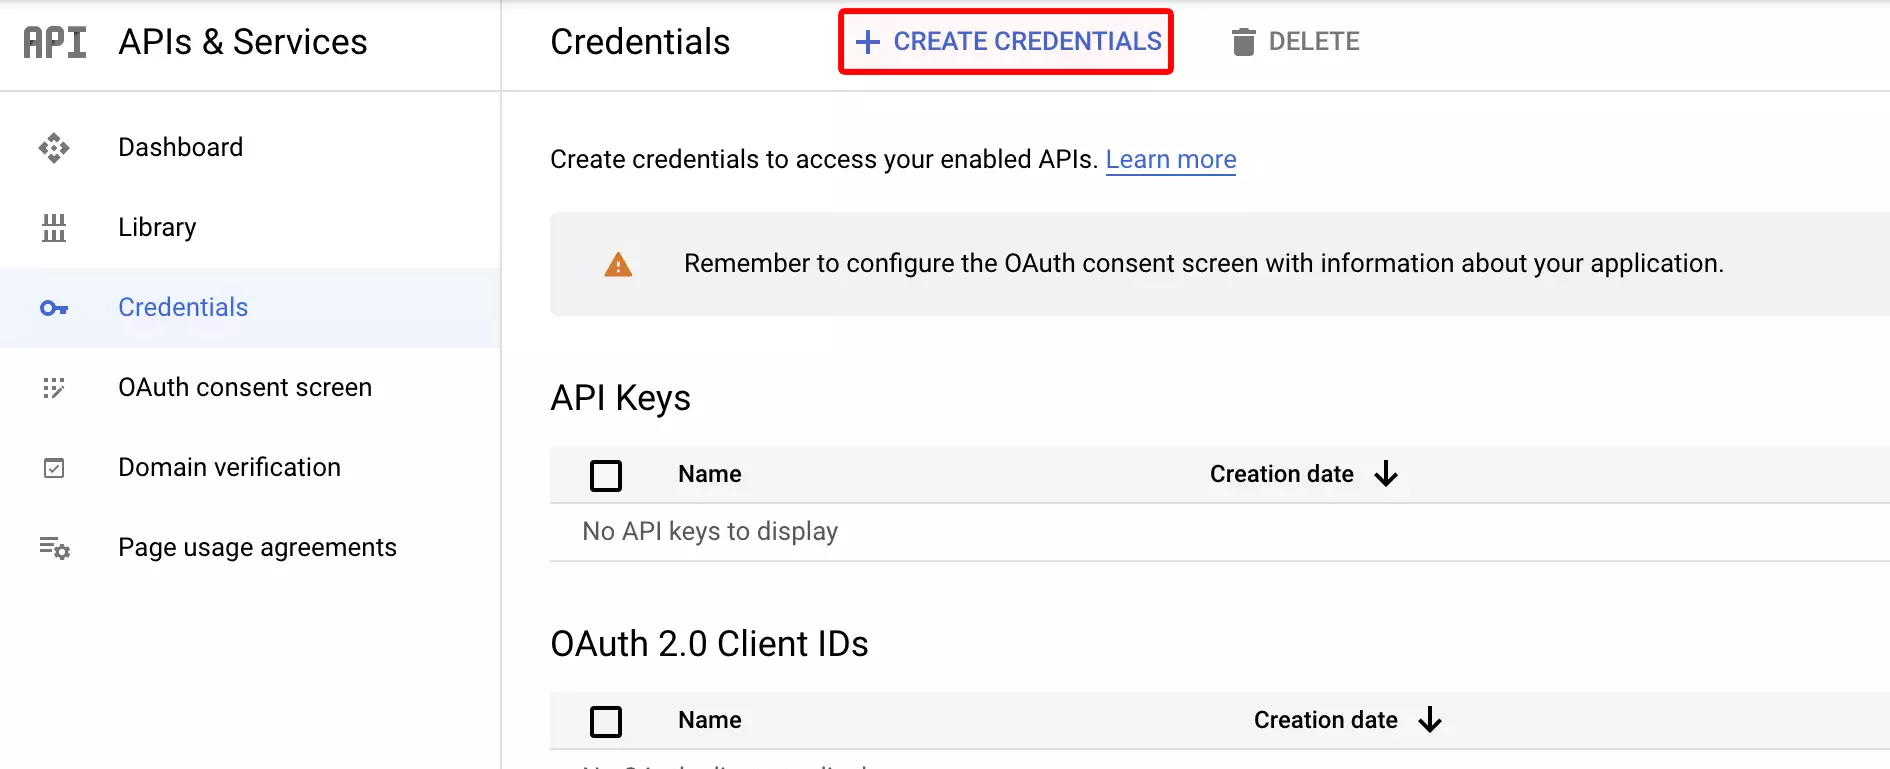
Now go back to where you were, on the 'Credentials' page, and you should see a new service account. Click on it, and navigate to Keys. From that page, click 'Add Key', and then create a JSON key.
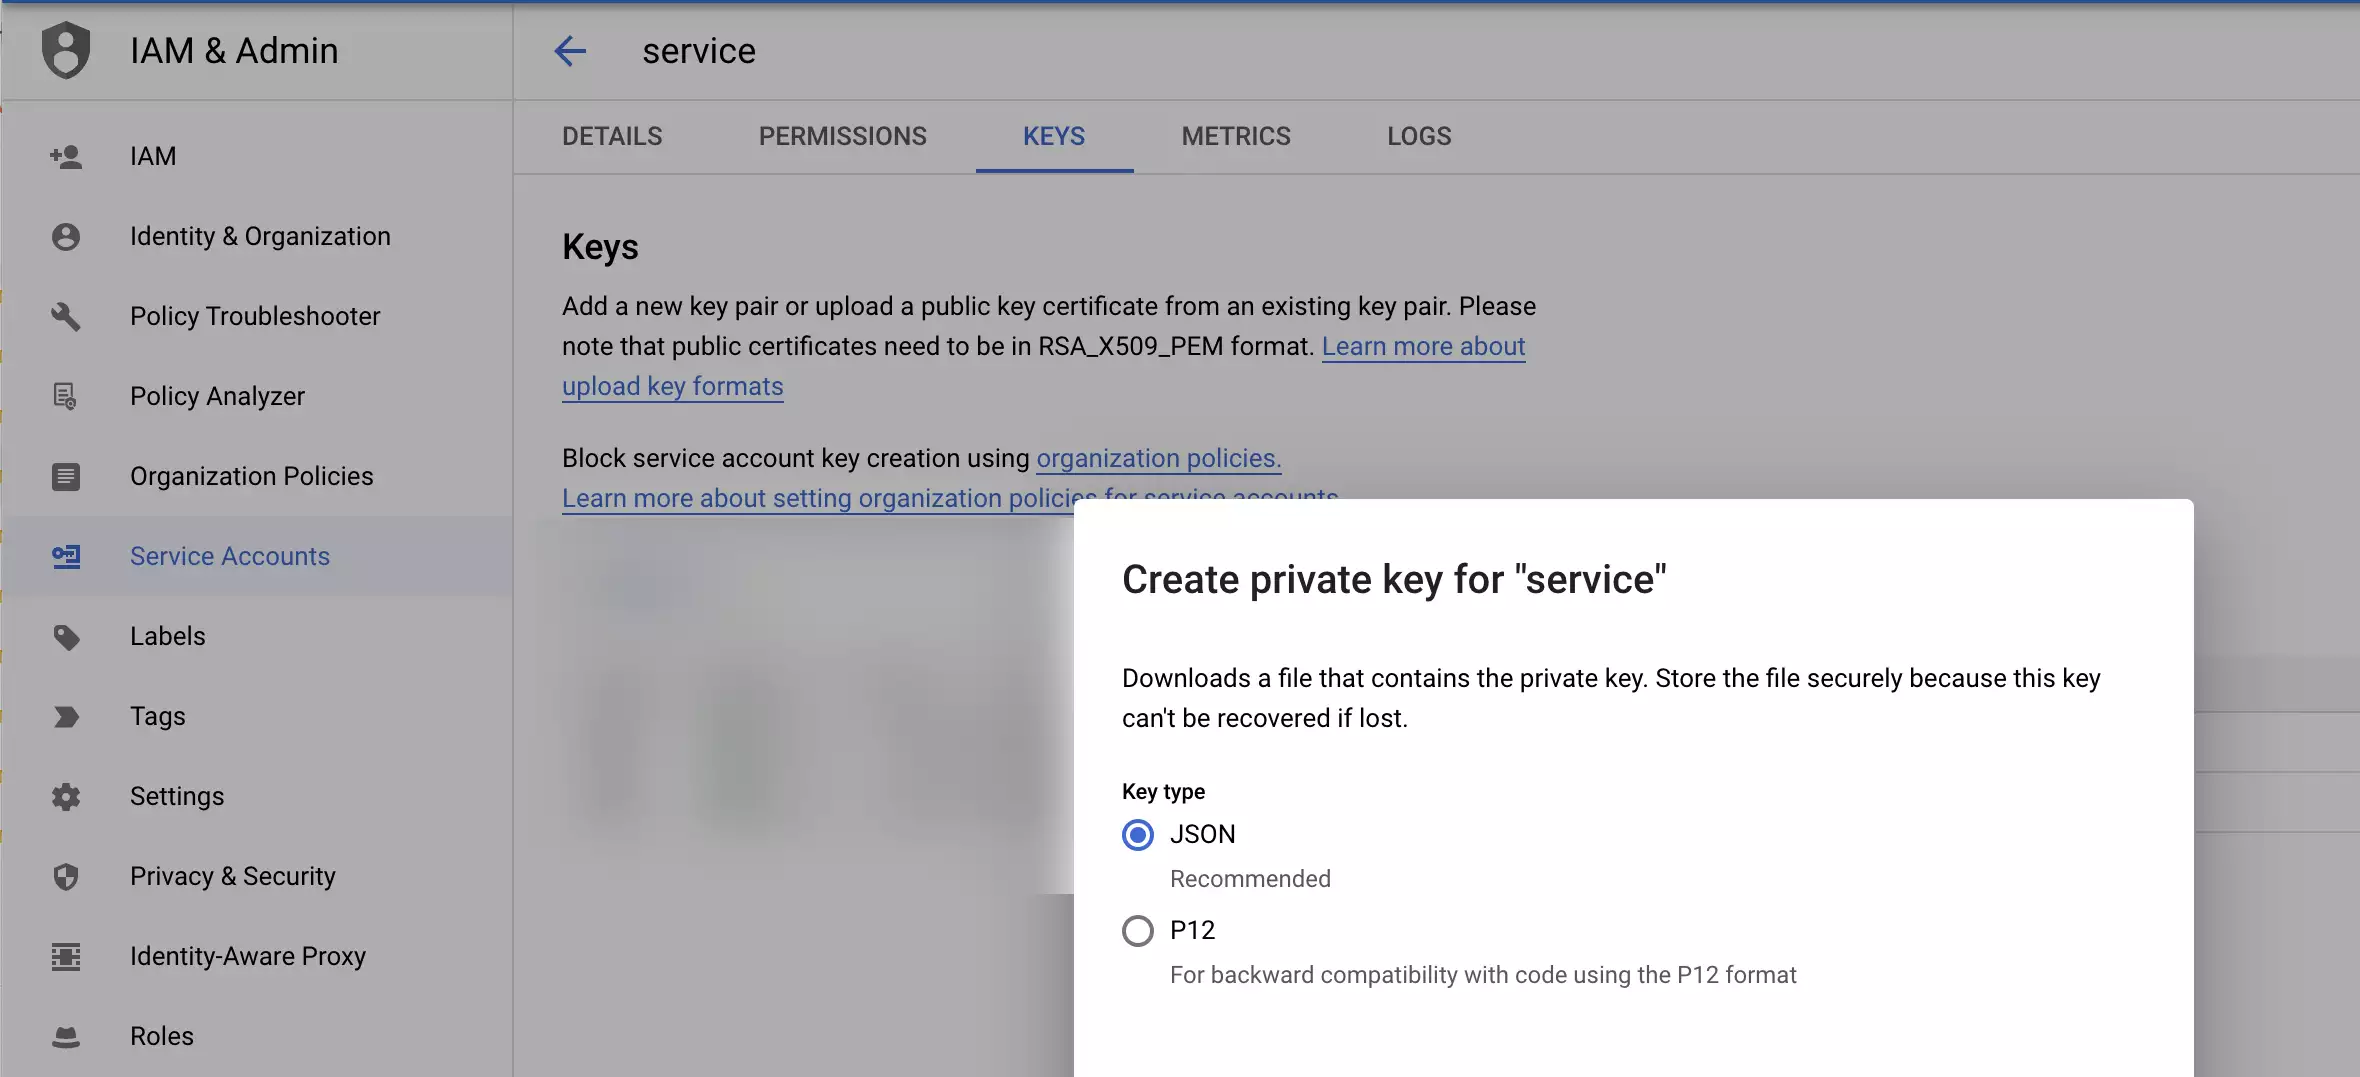
Great, now download that key, and keep it safe. We'll need it later.
Then navigate back to the project home page, and in the top search bar, search for 'Google Analytics Data API'. Enable this service for your project. Note, if you are using older versions of Analytics, a different version of the API is needed. Be careful you pick the right one for Google Analytics 4:
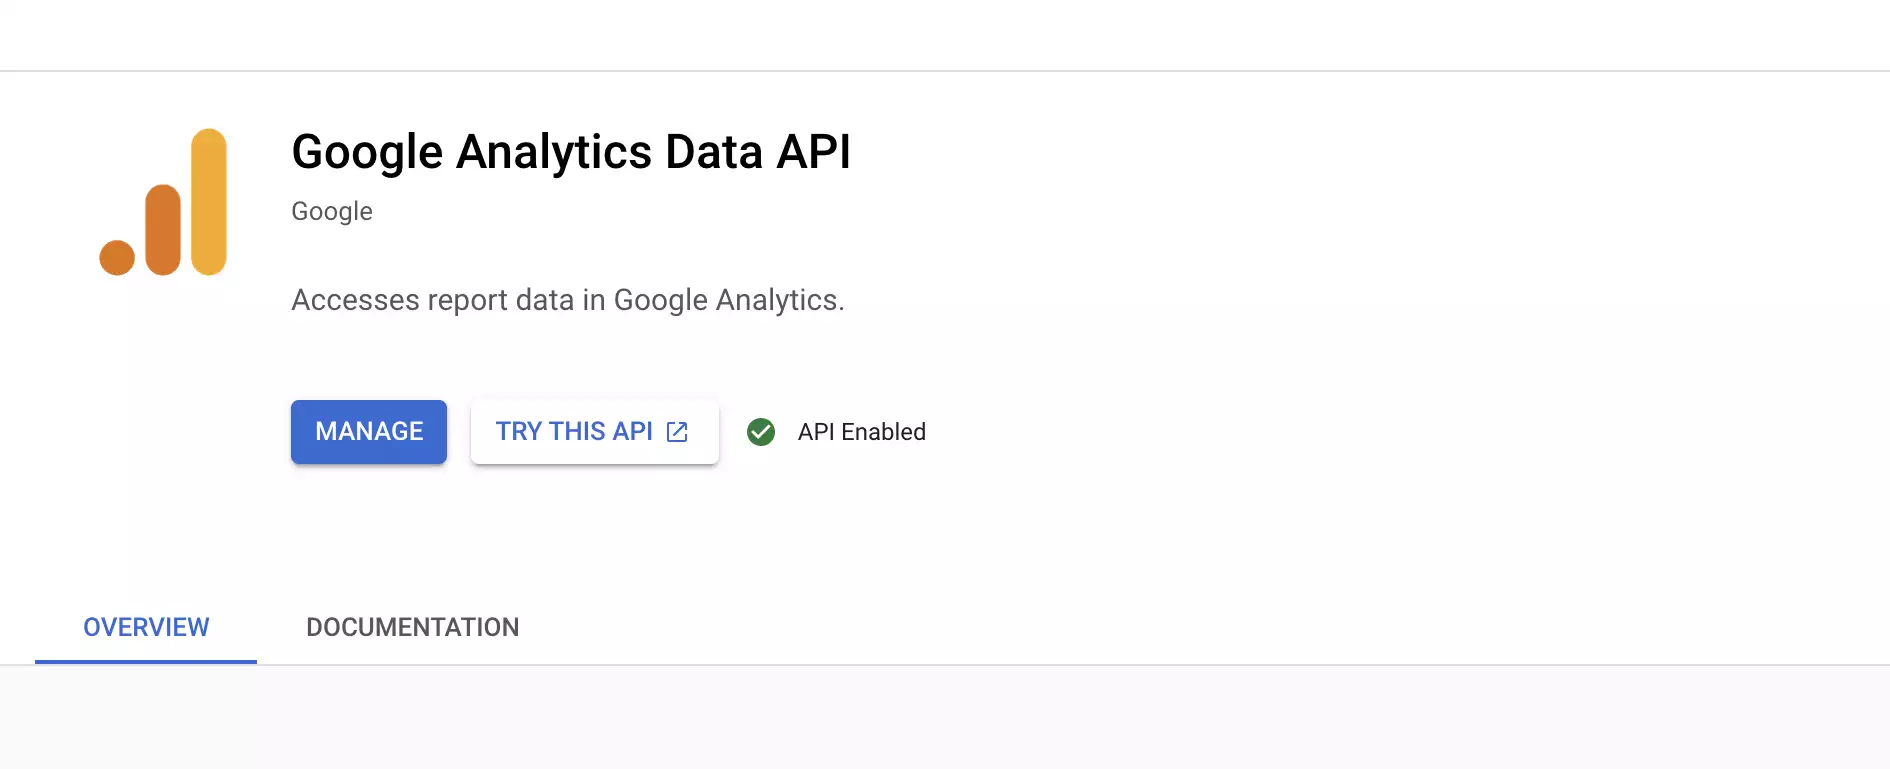
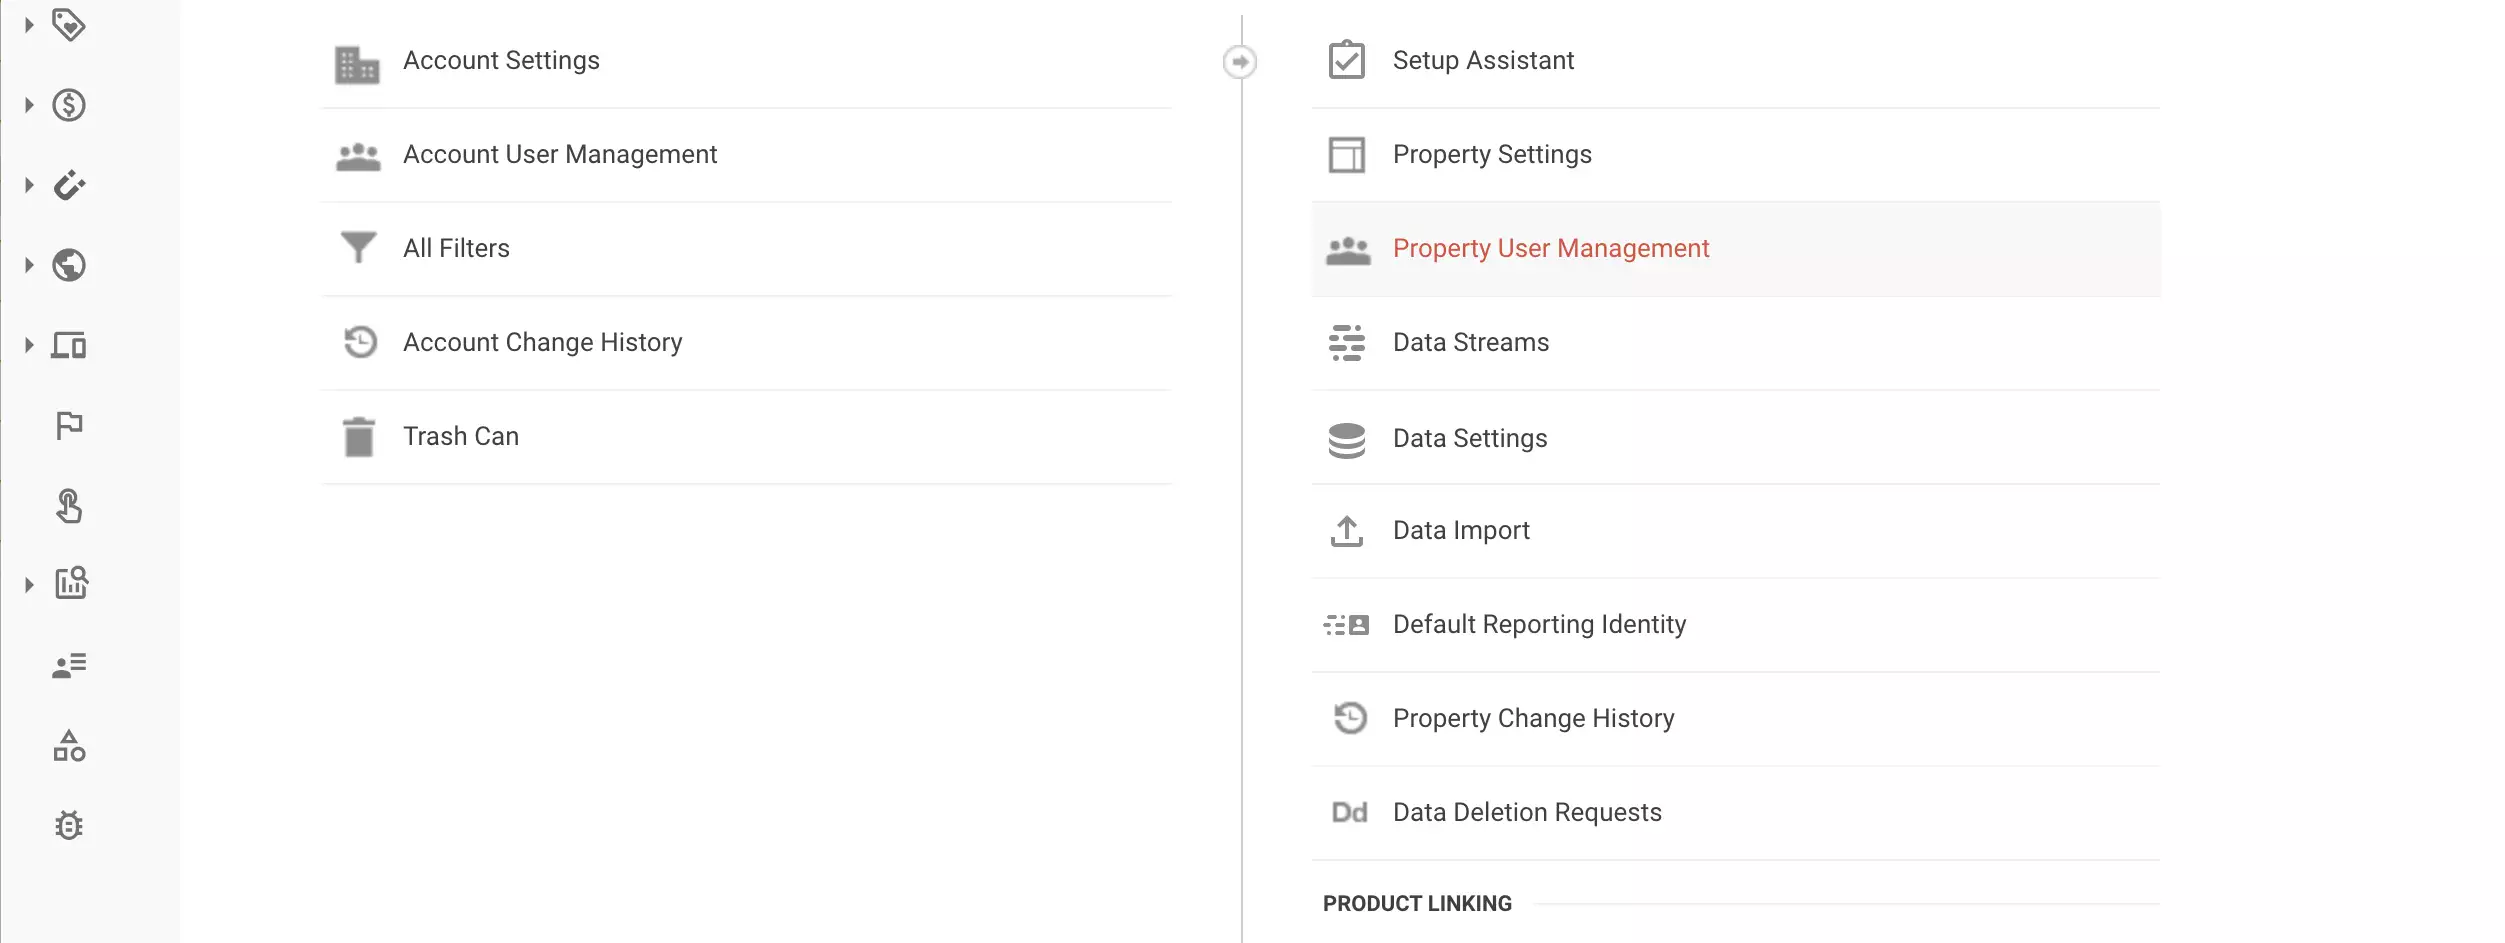
Finally, add your service account to your Google Analytics Property in the admin section of Google Analytics. You can do this by clicking on 'Property User Management', as shown below, clicking the big blue plus, and selecting 'Add Users'.
Add your service account email address. You only need to give it 'Read and Analyze' access.
Step 2: Link up to the API
Now that we have the housekeeping out of the way, we need to use the new Google Analytics beta client. As mentioned, there is a new API, which is subject to change, but this shouldn't affect us right now. Make sure you install the right package with: npm i @google-analytics/data
The 'key.json' file below refers to the key you will have downloaded from Google Service Account.
import { BetaAnalyticsDataClient } from '@google-analytics/data';
// Creates a client.

const analyticsDataClient = new BetaAnalyticsDataClient({
    keyFile: './key.json'
});
Now we have an authenticated Analytics object which we can use to ping Google Analytics and retrieve data. For this tutorial, I will be getting the most popular posts from my personal blog for the last month. All blog posts I write start with '/article/', so we can easily separate out the ones we want.
Step 3: Get the Analytics Data
First off, let's get the last 31 days of data, and pass it into an analytics report object. See the comments in the code for more details. Note you also need to update the propertyId below to your Google Analytics property ID. This can be found in the Admin section of Google Analytics, under 'Property Settings'.
let propertyId = 'ENTER YOUR PROPERTY ID HERE';
// Get the day 31 days ago
let today = new Date().getTime() - (60 * 60 * 24 * 31 * 1000);
// Get the day, month and year
let day = new Date(today).getDate();
let month = new Date(today).getMonth() + 1;
let year = new Date(today).getFullYear();
// Put it in Google's date format
let dayFormat = `${year}-${month}-${day}`;

const [response] = await analyticsDataClient.runReport({
    property: 'properties/' + propertyId,
    dateRanges: [
    {
        // Run from today to 31 days ago
        startDate: dayFormat,
        endDate: 'today',
    }
    ],
    dimensions: [
    {
        // Get the page path
        name: 'pagePathPlusQueryString',
    },
    {
        // And also get the page title
        name: 'pageTitle'
    }
    ],
    metrics: [
    {
        // And tell me how many active users there were for each of those
        name: 'activeUsers',
    },
    ],
});
When the data comes in, it will be in the 'response' variable. We'll want to make a few changes to this since:
- This data will contain URLs which are not blog posts.
- This data will also contain URLs that are redirects from other sites, which can contain query strings and odd characters.
So we have to first limit our search to only URLs starting with '/article/', and remove any noise that has been picked up on the URL. Massaging this data required a larger function than I expected, but essentially the raw Analytics data into a set of '/article/'s which ordered by view count. I only wanted the top 7, but you can adjust this as you like.
You may have to adjust this bit slightly for your own needs:
// newObj will contain the views, url and title for all of our pages. You may have to adjust this for your own needs.
let topRows = 7; // Number of items we want to return
let pageTitle = 'Fjolt - '; // The part off the front of the page title we want to remove, usually the domain name
let blogUrl = '/article/'; // The URLs we want to target.
let newObj = [];
response.rows.forEach(row => {
    // dimensionValues[0] contains 'pagePathPlusQueryString', and dimensionsValues[1] contains 'pageTitle'
    // We will remove and percentages from the end of URLs to clean them up. You may have to adjust this
    // If you make use of percentages normally in your URLs.
    if(typeof row.dimensionValues[0].value.split('%')[1] !== "undefined") {
        row.dimensionValues[0].value = row.dimensionValues[0].value.split('%')[0];
    }
    // We will remove the domain title from the start of the pageTitle from dimensionValues[1], to only give
    // us the page title. Again, you may have to change 'Fjolt -' to something else, or remove this entirely.
    if(typeof row.dimensionValues[1].value.split(pageTitle)[1] !== "undefined") {
        row.dimensionValues[1].value = row.dimensionValues[1].value.split(pageTitle)[1];
    }
    // We only want articles that have URLs starting with /article/
    if(typeof row.dimensionValues[0].value.split(blogUrl)[1] !== "undefined") {
        // This function will push an object with the url, views and title for any /article/ page.
        // If the article already exists in 'newObj', we will update it and add the views onto the old one
        // So we have one entry only for each article.
        if(typeof row.dimensionValues[0].value.split('?')[1] !== "undefined") {
            let findEl = newObj.find(el => el.url == row.dimensionValues[0].value.split('?')[0]);
            if(typeof findEl == "undefined") {
                newObj.push({
                    url: row.dimensionValues[0].value.split('?')[0],
                    views: row.metricValues[0].value,
                    title: row.dimensionValues[1].value
                });
            } else {
                findEl.views = `${parseFloat(findEl.views) + parseFloat(row.metricValues[0].value)}`;
            }
        } else {
            newObj.push({
                url: row.dimensionValues[0].value,
                views: row.metricValues[0].value,
                title: row.dimensionValues[1].value
            });
        }
    }
});
// We will order the articles by their view count using sort()
// This will give us a list of articles from highest to lowest view count.
newObj.sort((a,b) => (parseFloat(a.views) < parseFloat(b.views)) ? 1 : ((parseFloat(b.views) > parseFloat(a.views)) ? -1 : 0))
// I only want the top 7 articles, so I'm splicing that off the top.
newObj.splice(topRows, newObj.length);
Step 4: Create a UI
The next step is totally up to you. From this data, I wanted to create a simple UI which would display the most popular articles live on my page.
My simple UI looks a bit like this, which is returned in the html variable for use where you want it.
let html = '<h2><i class="fas fa-fire-alt"></i> Recently Popular</h2><ol>';
newObj.forEach(function(item) {
    html += `<li><a href="${item.url}">${item.title}</a></li>`
});
html += '</ol>';

return html;
Step 5: Relax
After all that, we have a simple most popular widget based on realtime Google Analytics 4 data. The final code can be found here, and a demo can be viewed on your left on Fjolt.
More Tips and Tricks for Javascript
- A Complete Guide to Javascript Maps
- How to install nvm, the Node Version Manager
- Javascript Shallow Copies - what is a Shallow Copy?
- Detecting Device Orientation with Javascript
- Websockets Tutorial: Creating a real-time Websocket Server
- How to use Environmental Variables in NodeJS
- How Generator Functions work in Javascript
- Changing HTML Classes and Attributes in Javascript
- Import, Export and Require in Javascript
- How to Make Payments with the Javascript Payments API